


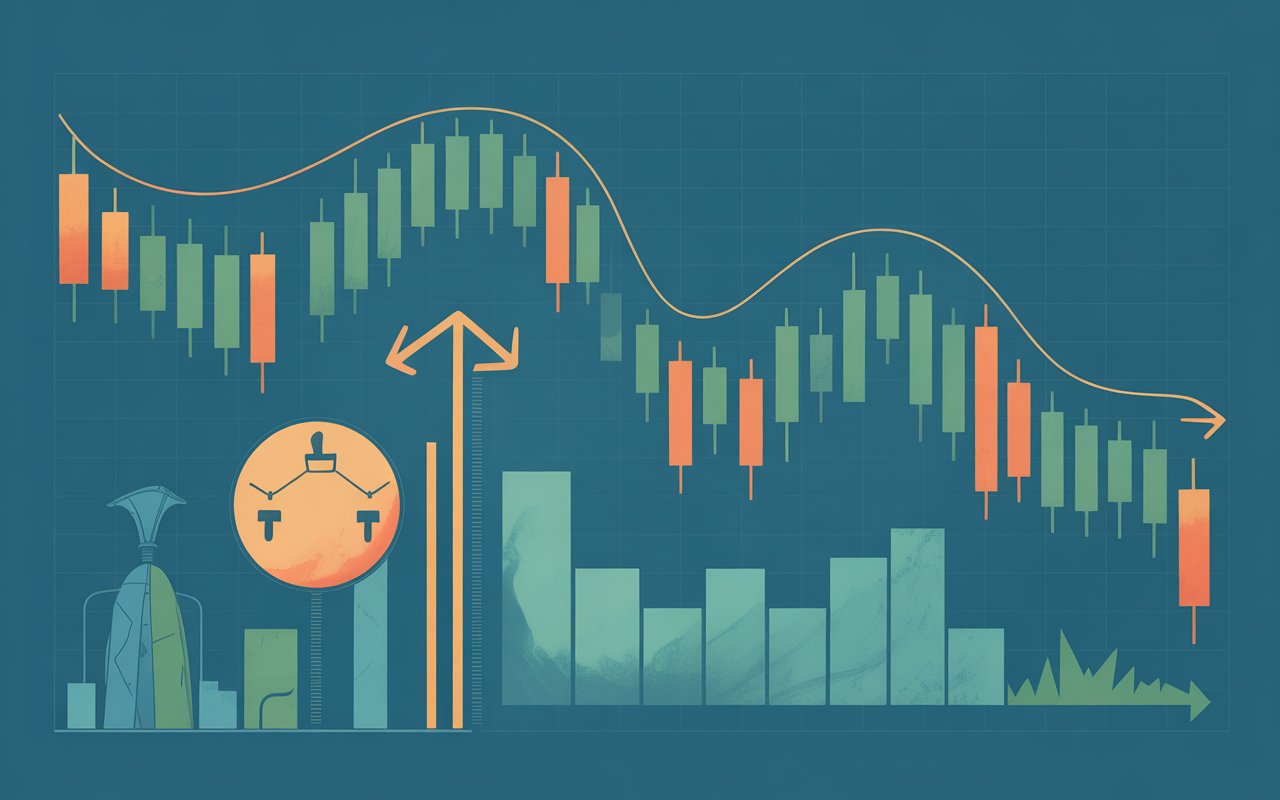
Bullish and Bearish Reversal Price Action: A Complete Guide for Everyday Traders
Price charts might look like a tangled web of squiggly lines, but to seasoned eyes, they tell a story — a story of optimism, fear, greed, and hesitation. Whether you’re a casual investor or just curious about how traders read these signals, understanding bullish bearish reversals can help you see the market’s hidden messages.
Think of it like learning body language — just as a friend’s smile or frown hints at what they’re feeling, price patterns can reveal whether buyers or sellers are taking control. Let’s explore how this works, step by step.
What Does Price Action Really Mean?
Price action refers to the natural ebb and flow of a security’s price as it changes over time, captured directly on a chart without relying on additional indicators.
No complicated tools or tricky formulas — just the pure, unfiltered movement of price laid out on a chart. Traders watch this movement closely to spot clues about where the market might go next.
A bullish reversal is when prices shift from falling to rising, while a bearish reversal is when they turn from rising to falling. These changes can be subtle or dramatic, but in both cases, they hint that the balance between buyers and sellers is shifting.
The Psychology Behind Market Reversals
Markets aren’t moved by numbers alone — they’re driven by human emotion.
When fear dominates, sellers flood the market, pushing prices down. When confidence (or greed) takes over, buyers step in, driving prices higher.
A bullish reversal often starts when sellers tire out and buyers see an opportunity. A bearish reversal, on the other hand, happens when buyers lose steam and sellers take control. Spotting these changes early can be the key factor that separates a winning trade from a losing one
Bullish Reversal Patterns: The Market’s Green Light

Let’s break down the most common bullish reversal signals:
1. Hammer Candle
Picture a small body with a long lower shadow — like a hammer hanging upside down. This pattern shows that sellers drove prices lower, but buyers regained control and pushed the close back near the opening level.
2. Morning Star
This is a three-candle formation:
-
A large bearish candle
-
A small-bodied candle (indecision)
-
A strong bullish candle that ends with its close positioned above the halfway mark of the first candle.
It’s like the market yawning awake after a bad night — a new day, a fresh start.
3. Double Bottom
Imagine the market falling, bouncing back up, then falling again to roughly the same low, and finally climbing. It’s like testing the floor twice — if it doesn’t break, buyers gain confidence.
Bearish Reversal Patterns: The Market’s Red Light
Now for the flip side — signals that prices might head lower.
1. Shooting Star
It’s the hammer’s inverted twin — a small body topped with a long upper wick.. Buyers pushed prices up, but sellers swooped in to close near the opening price.
2. Evening Star
The bearish twin of the morning star:
-
A strong bullish candle
-
A small indecision candle
-
A strong bearish candle that finishes with its close falling beneath the halfway point of the first candle.
It’s the market turning out the lights after a party.
3. Double Top
Prices rise, pull back, rise again to the same level, and then fall. Think of it like bumping into the same ceiling twice — eventually, gravity wins.
Volume: The Voice Behind the Price
Price action without volume is like a speech without emotion. Volume tells you how strong a move really is.
A bullish reversal with high volume means buyers are serious; a bearish reversal with heavy volume means sellers are taking charge. Low volume can signal that the reversal is weak or short-lived.
Timeframes and Context Matter
A bullish reversal on a 5-minute chart might excite a day trader but mean nothing to a long-term investor.
Always consider:
-
Your trading style (day trading, swing trading, investing)
-
Market environment (bull market, bear market, sideways market)
-
Other clues (support/resistance, news events)
Without context, a reversal can be a false alarm.
Avoiding False Signals
Not all hammers or double tops signal an actual shift in trend. Sometimes the market fakes one direction before going the other way — known as a “fakeout.”
To reduce mistakes:
-
Hold off until you get confirmation, such as a candle closing clearly above or below a significant price level.
-
Look at multiple timeframes
-
Consider volume and broader trends
Using Support and Resistance with Reversals
Support acts like a sturdy floor, while resistance serves as a solid ceiling. When price action shows a reversal near these levels, the signal becomes stronger.
For example:
-
A hammer forming at strong support can hint at a bullish reversal.
-
A shooting star at resistance strengthens a bearish case.
Combining Price Action with Indicators
Pure price action traders avoid indicators, but some prefer extra confirmation. Tools like the Relative Strength Index (RSI) or Moving Averages can help confirm whether a reversal is likely.
For example:
-
Bullish reversal + RSI oversold = higher confidence.
-
Bearish reversal + RSI overbought = stronger signal.
Real-Life Analogy: The Tug of War
Imagine two teams in a tug of war — buyers on one side, sellers on the other.
-
In an uptrend, buyers are pulling hard, sellers are resisting but losing.
-
In a bearish reversal, sellers dig in, yank back, and start pulling the rope their way.
-
In a bullish reversal, buyers rally after being dragged forward, suddenly pulling back with force.
Price action is just the visual record of this ongoing struggle.
Practicing and Developing Your Eye
Spotting reversals takes practice. Try:
-
Reviewing historical charts to see how reversals formed
-
Practicing on demo accounts
-
Keeping a journal of your trades and observations
Over time, you’ll start seeing patterns without even trying — like recognizing a friend’s voice in a crowd.
FAQs
1. Can reversals happen in any market?
Yes, whether it’s stocks, forex, crypto, or commodities, reversal patterns work across markets because they’re based on human psychology.
2. How do I know if a reversal is real?
Look for confirmation through volume, multiple timeframes, and price closing beyond key levels.
3. Are reversal patterns always accurate?
No — they can fail, especially in volatile or news-driven markets. Always use stop-loss orders.
4. Can beginners use price action to trade?
Absolutely, but it takes practice. Start by learning a few basic patterns before moving to advanced setups.
5. What’s the difference between a reversal and a pullback?
A reversal changes the overall trend direction, while a pullback is a temporary move against the current trend.
Conclusion: Reading the Market’s Mood
Bullish and bearish reversals aren’t magic predictions — they’re clues. By reading these clues in the context of volume, support/resistance, and market conditions, you can make more informed decisions.
Whether you’re an active trader or just keeping an eye on your investments, understanding these patterns is like learning a new language — one spoken by the markets themselves.